If Triangle Proofs are the aspirin, what is the headache?

Prove that two triangles are congruent.  Sometimes seen as the “first real proofs” of a Geometry course (but they should probably not be the first proofs done, and the types usually done aren’t much of proofs– but let that be for now).

How do you get students to feel the need to prove?  How do we give them a reasonable headache alleviated by the learning target’s aspirin?

The headache-aspirin idea can be illustrated like this:  add the first 100 integers.  1+2+3+…+100. The headache is that it seems like a lot of tedious work, but using Gauss’ arithmetic series folding idea, we fold the long sum onto itself and add pairs inward: 1+100, 2+99, … getting 50 sums each equal to 101, thus finding the sum of integers from 1 to 100 is 5050.  This legend is oft repeated as Gauss’ clever way to get around a teacher’s tedious punishment: notice how even in legend we appreciate the origin of a clever idea as a way to reduce tedium.

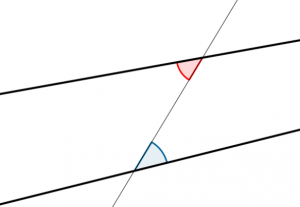
Back to triangle proofs.  We want students to see SSS, SAS, ASA, HL (SS-rightA) as useful tools to show that two triangles are congruent.  Dan Meyer made an astute comment: If proofs are the aspirin, the doubt is the headache. The congruency shortcuts are very abstract, but furthermore, a student may not have reason to believe or disbelieve whatever you are going to say on the subject of congruecy.  Two threads emerge here:

(1) why do we want to show triangles congruent?  How can we make a student doubt that triangles may be congruent?

Triangle congruence is our tool of two dimensional congruence.  So we need to have students care about congruence in general.  If your students are philosophical (and many are) then studying the idea of sameness/congruency has some grounding there. But all students are going to want something concrete as well.

(2) why do we use these little 3 part shortcuts?

The accepted shortcuts are an efficient result.  Nothing wrong with showing triangles are congruent by matching all six parts: SASASA — nothing wrong except efficiency. Arriving at the result of the triangle congruency shortcuts can be done by students themselves.

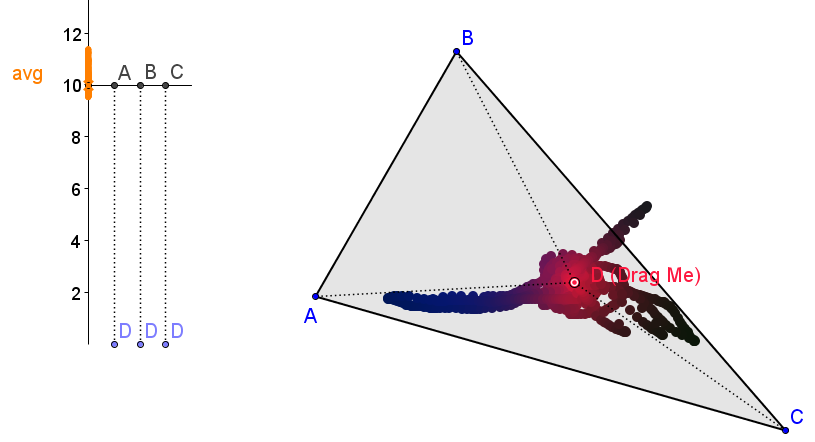
So here’s my scratchwork for a lesson idea: work from the opposite case, can we make a student doubt that different triangles exist? Building Different Triangles We infuse doubt by assigning students to find non-congruent triangles.  When they run up against their sandbox’s boundary– the conditions that cause some triangles to be automatically congruent– they can all of a sudden doubt that triangles can always be made differently.

Students in groups are given the task to build different triangles than their groupmates, given a set of matching triangle parts.  The given parts are either physical manipulatives or digital (advantages with each one)

0. Do we agree that if three sides and three angles are given to us, we can make only one triangle?  Why or why not?

0.5 Think ahead, what if we are given only 5 parts, can we make two different triangles?  What about given other numbers of parts, like 2?  Can we make different triangles then? How many different triangles?

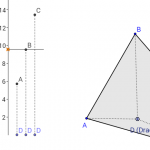
1. Given A=30, AB=3, BC=2.  Make as many different triangles as possible. Related concept: SAS, Law of Cosines eventually.  Geogebra interactive.

ASS has a bad reputation

Geogebra applet exploring Angle Side Side

2. Given AB=3, BC=2.  Make as many different triangles as possible.  Related concept: triangle inequality.  Geogebra interactive.

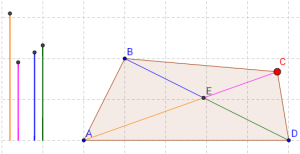
3. Given AB=5, BC = 4, CA = 2.  Make as many different triangles as possible.  Related concept: converse of Pythagorean theorem.  Geogebra Interactive.

4. Given A=40, B=30, AB=5.  Make as many different triangles as possible.

5. Given A=40, B=30, BC=5.  Make as many different triangles as possible.

6. Given A=53, B=57, BC=5.35, AC=5.1.  Make as many different triangles as possible.

Be careful with the chosen values.  Sometimes (especially the first one) you want the students to arrive at different triangles.  Save the “we can’t!”/”they’re all the same” moment (SSS (3) / AASS (6) ) for later in the progression.

We also don’t need to restrict ourselves to tech-based manipulatives.  Straws and string work great for the SSS case.

What kind of conjectures would students make when exposed to this kind of task?  Many will apply the triangle angle sum, or have it solidified in their mind: meaning they can conjecture we at most need to be given two angles.  Hey, that’s a proposition we can prove!  That’s one students can prove, or at least justify.  And its not arbitrary or needless: its something that is a significant step towards reducing tedium of triangle differentiation.  If we know two angles, we know the third.

And how about conjecturing and proving statements like: to show two triangles are congruent, at least three parts must be known. (note, hypotenuse-leg gives three parts: two sides and the right angle) Or, at least one side must be known. These are within the grasp of proof by the students because they will have had the experience of seeing the counter examples and of building intuition about what forces the known congruency shortcuts to be what they are.

Thoughts?  extensions?

#ContinuumMath – join the movement!

I’m starting a new movement.  Maybe its not new– and in that case I’m grabbing a banner and rallying the movement!

All too often we talk only about special cases in the math classroom.  All of our teaching revolves around pointing out landmarks and marvels.  But how can our students appreciate such phenomena if their experience never includes the cases that are not marvelous?  If you live your whole life in Yosemite, how would you know how special it is?

That is my thought behind #ContinuumMath.  We need to shake up the special cases by spreading student experiences to include the countless non-special cases.

  • Going to talk about SSS or SAS triangle congruency?  Why not talk about “SS” ?  Why are we always using 3 parts of a triangle?  I myself prefer “SASASA” congruency.
  • The natural exponential function e^{x} 
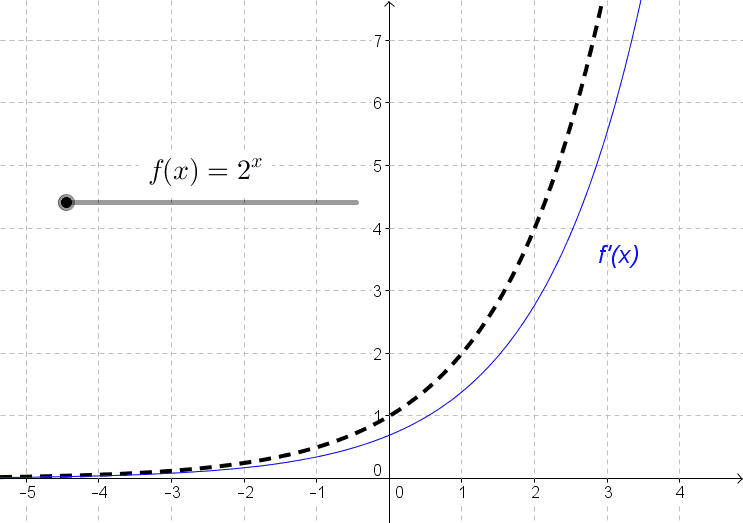
can be explored in the context of all of the other exponentials whose derivatives are merely proportional instead of equal to their output values.

    e to the x

    (click for animated GIF)

  • I’ve previously discussed that lines are not always parallel.  Corresponding and Alternate Interior angles are not very interesting if our “desire for congruence” is always fulfilled.
  • Algebra: 5x+4 = 34.  “2 step equation”?  Heck, I can solve that equation in 7 steps!  How about this: Students… try using 5 properties of equality (“steps”) for this equation to get to x=6 — I bet you’ll use at least one additive inverse and at least one multiplicative inverse.  The inverse properties come out naturally as the most efficient moves.two step equation in five steps
  • CaptureWe have lots of new technology to assist us in exploring whats around the special case. Constructing equidistant points with a compass and straightedge is what can be done after we experience [GGB] how distances change.

Students who experience all of these non-special cases then see the special cases as actually special.

Every time your textbook or curriculum offers up a wonderful case– they’re just begging to be shaken up and explored in the context of the structures they depend upon.  This is the Gift of Sometimes True.  Whenever we are giving a theorem or an if-then statement, we can parameterize the condition.  Here’s what I mean:

The diagonals of a parallelogram bisect each other.

quadrilateral diagonals 2We can take that and say, the diagonals of a quadrilateral bisect each other if the quadrilateral is a parallelogram.  And now we want to consider the entire continuum of quadrilaterals– I want students to see quadrilaterals that are almost parallelograms, quadrilaterals that are nowhere near parallelograms, and everything in between!  We further get to talk, as a bonus, about all of the properties of diagonals in other quadrilaterals.  Try the geogebra applet for yourself.

In this applet I parameterized the quadrilatral, but not fully: its impossible to get a rectangle or rhombus here– a tradeoff I made for simplicity of interaction: you can only drag point C.  But as students drag, they observe the diagonals and their dissected lengths.  They can make observations and comparisons in real-time, and they can conjecture and posit as they experience and interact the structure of the geometry.  Students will find the parallelogram.  Students will find the trapezoid.  Students will also find locations where three segments are equal.  Students will find quads that contain isosceles triangles formed by their diagonals… Students will discover so much more because they are seeing so much more than the narrowness of the special case.  Embrace the Continuum.

Check out #ContinuumMath on twitter and/or leave replies here.

Student Inquiry into the Neighborhood of the Special Case

Lets look at Triangle Centers: a fun unit for many Geometry classes.  Its a topic with some good “real-world” applications, certainly, but we need not always justify our lessons with application.  And it may hold us back from important mathematical practices.  Pure math is underrated!  Lets compare some traditional textbook style application problems with an interactive style problem.  First, Holt Geometry:

angle bisector from holtangle bisector 2 from holt
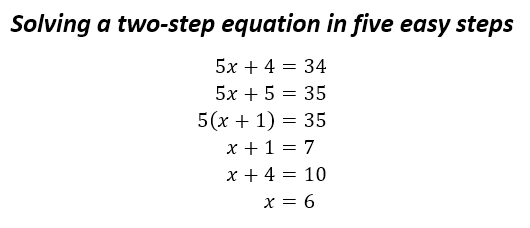
Those two problems are somewhat typical of some application motivators.  But consider a correct response from a student:

18.  Main street should be the angle bisector of the angle between Elm Street and Grove Street.
37.  Bisect the angle between the streets.  Draw the perpendicular bisector between the museum and the library.  The visitors center should be where those two lines cross.

How does this capture the imagination of a student?  If they know what an angle bisector is, they can supply an answer.  But if they do not know it (or haven’t made the connection about equidistance from sides) what kind of feedback can you give them that guides them to the answer without providing the answer?

But the book already provided the direct answer, earlier in this section: Theorem: a point is on the bisector of an angle if and only if it is equidistant from the sides.  #18 is almost explicitly asking for this theorem.  #37 asks a little more: it wants this theorem combined with the perpendicular bisector theorem, which led off this section– no prelude.  These questions are merely dressed up versions of those on Level 1 and Level 2 of Bloom’s Taxonomy.


With GeoGebra, we can provide loads and loads of information that (1) helps guide the student around the topic we want and (2) does not provide progress towards “the answer” in discrete unassailable steps.  We can be more helpful while being #lesshelpful.

dist vertex 01Here is a picture of an applet I created to give some real-time information to students about point D and triangle ABC.  And here is the interactive applet itself, try it!

In this first static picture, what information is given to students?  Most students will be keen enough to see the comparison of the distances DA, DB, DC.  And all students will catch on after they start dragging point D.

What do we need to ask here to get students to think about perpendicular bisectors?  I say: “not much!”  My introduction to the applet is “Drag point D.  Find special locations.”  That’s not to say I’m not communicating with the students.  I’m communicating a great deal more!  I’m communicating through the boundaries and feedback programmed into the Geogebra manipulative.  Manipulatives are powerful in any setting, but computerized manipulatives enable modes of lessons not possible before.

I love doing triangle center lessons via oragami (or patty) paper.  I love doing triangle center lessons via compass and straightedge.  But the boundaries of those manipulatives do not guide the students.  If you make an incorrect fold or line, the paper doesn’t tell you so.  If you want to test distances with your compass or ruler, you must do them one at a time.  If you want to pursue a question other than equidistance (e.g.) then there may be other complicated procedures to follow.

Consider with GeoGebra:  by restricting the interaction to only dragging D, the students may no longer make unproductive moves.  Every move they make produces feedback via the distance “bar graph” and the color shading of D itself.  That feedback isn’t telling the student “incorrect”.  It is telling the student “here are the distances your input asked for.”  The student is then left to parse that information, and respond with more input.  This type of interaction between student and computer occurs within a fraction of a second.  And this type of interaction is repeated tens, hundreds, or thousands of times.  The student can then use the information to start digging into the prompt: what are the special locations for D?  What makes a location special anyway?  These are questions that can be asked and answered by students without teacher interruption.

dist vertex 02But wait, there’s more!  Lets say a student has decided upon finding the place where DA=DB=DC.  Computerized Manipulatives now allow a task between this decision and the answer.  They must spend time actually getting point D to the correct spot.  In this Geogebra applet, they have the feedback from color and the bar graph to help them, but here is where the teacher can wait for a student to ask, “is there a better way?”  Boom!  We have arrived at the motivation for the circumcenter construction.  This motivation was driven by “pure” math ideas like equidistance… only we didn’t have to say it.  Proof in geometry should be introduced as a way to perfect our conjectures and hypotheses.  If the students haven’t made a conjecture, how are they going to care about its truth?

In this applet I decided to include an extension: another triangle center.  But this is not the usual 2nd center introduced.  Your students will find the blue point and notice what is special. Try it yourself!  Think about what is also done with this wordless separation of the two points in contrast to a lecture-based introduction: the students will have their own vocabulary to parse the difference that they have played with already, instead of the students having to parse vocabulary that describes a difference that they may not have been aware of.

In this applet I included two “answer” checkboxes.  Depending on where you want to take your class next, it they may steal some thunder from the lesson, but I figured I’d include them to help illustrate the point… and points. (hah)

GeoGebra and other computerized manipulatives enable us to think about Geometry and math in a way unfamiliar from static text or lecture.  Similar to The Lines Are Not Always Parallel, I’ve created a way for students to observe the neighborhood around the special case, and constructed silent helpful barriers and footholds that students can grab onto as they discover what is special for themselves.

Let me know what you think.


Efficient Grading in Four Easy* Steps

Recently, Michael Fenton (@mjfenton) posed the following question:

I thought back to the types of grading I was doing in my first few years of teaching.  I would go through problems with a fine-toothed comb, taking points off the maximum… minus one here, minus two there… minus 1.5 point here, because “I can tell you know it, but you forgot a negative sign a couple steps ago, and as we all know, negatives signs are worth half a point”.  I would make sure all my tests had appropriate weights on each question, “number 2 is worth 5 points, and number 3 is worth 7 points” (because it’s 140% harder!) and I made sure to write very encouraging comments or constructive criticism that I’m sure contained very little mistakenly copied dialogue from the CSI episode I was watching.  “Jimmy, you have a good idea here when you divide the perimeter by two, but did you gather the DNA sample from the suspect?”   And of course, my gradebook followed precise weights and scales: “yes, 30% tests, 15% quizzes… because if I say the word test I want to make sure you stress exactly twice as much over each problem– also you have less time.”

It was exhausting.  And with more experience I was beginning to see where the extra work came from, such as evaluating the worth of assignments, problems, and categories of problems– a task that required extreme time and effort to nudge the system way from seemingly arbitrary.  Finally, I thought about what students were gaining from all of my extra work– I concluded, “not much.”

If this sounds like you, I offer these steps, in increasing levels of difficulty, to make your grading more efficient.  These are things I gradually adopted over a couple years.  The steps are simple, but the effects transform your teaching itself.

  1. All integer points.
  2. All problems on the same scale.
  3. Skip comments. *
  4. (we’ll get to #4 a little later)

Lets talk them through. We’ll see how they tie together and how they alter the culture of the classroom.

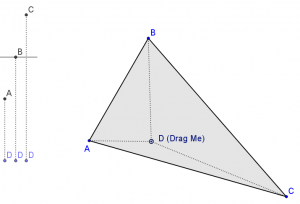
1.  Stop giving fractional points.  And further, reduce the total possible point outputs.  Your teacher brain is expending calculation energy dealing with fractional points or a wide range of possible scores.  Why?  Because you want to summarize that the student has the concept but has missed some details.  What message does this send?  “I am somewhat ok with you being not attending to precision” ?  (CCSS.MP6)  Because you want to be completely sure about the value of this student’s work?  Grading is a loss of information, we boil down a student’s work into a numerical value, an irreversible process, and an imperfect science anyway.  Do you know what an 8 point score looks like in comparison to an 8.5 point score?  Or even 8 points vs. 9 points?  (out of 10, lets say) This is like the coastline paradox: you can spend a great deal more energy to find a measure that may be only slightly more useful– or may be less useful even.  Does it make sense to measure the coastline of England on a scale that is affected by the tides?  And are they missing half points a lot?  If so– maybe its not so minor a problem.  If not– then what difference will one half point make in the end?  Now I’m not saying to round it all down.  Where you go from what you might previously have given an 8.5 will depend on other factors.  This step can be adopted by itself, you just have to decide how important those tiny errors are to the overall measure of the student’s work.  You’ll save a lot of energy on your end that can be applied to other areas, and you’ll lose only a little more information than what you previously had.

2. Put all problems on the same scale.  Now that we have no fractional points, lets simplify our life even more: no more deciding what a problem is worth.  No 3 point problems, no 12 point problems, no 11 point problems.  Let us have all problems worth an equal amount with a small number of divisions.  Now, let us also define a “problem” as something that requires work and reasoning to be shown. This can vary depending on the course, but in general, a problem is not multiple choice, or fact recall, or calculation-only.

What do we want to communicate to the student?  We shouldn’t detail what is wrong or incomplete, that should be a skill practiced by the students themselves.  So what do the students need in order to practice that skill?  They only need to know if their work is insufficient.  So to that end, I grade every problem on a very simple rubric: 4, 3, 2, 1, 0.  These numbers communicate to the students the following ideas:

4: Full detailed solution
3: minor revisions needed
2: major revisions needed
1: a mathematical effort in the right direction
0: blank or no mathematical effort

holistic grading

The main idea here is that we want to communicate that the student’s work can be improved.  And that if they were to make revisions, it could be re-evaluated and their grade could improve.  I based my structure on ideas I heard from Dr. Kysh at SFSU during my credentialing program, Riley Lark (now of ActivGrade), and Richard and Rebecca DuFour.  See more comments from Riley here: http://larkolicio.us/blog/?p=800.  The DuFours argument was specifically about late work– why not accept it?  “Hey you didn’t pay your electric bill on time last month– so just forget about it!”  This idea of revising work means that the assignments that you give are automatically more meaningful.  The student remains accountable for their work after they turn it in and they are tasked to figure out how to improve it.  That’s a valuable skill!  And it relates to another Mathematical Practice standard: CCSS.MP3 critique the reasoning of others.  Peers can help each other figure out what is lacking in their work, and what can be improved.

A quick note about scaling: the familiar 90-80-70 scale has a built in pressure towards “completionist” grading.  It assumes that you will be averaging.  It assumes that students will “complete” “50%” of their “work” (feel free to do air quotes along with me) before its even close to being acceptable.  What does it mean to know 70% about solving equations?  What is the difference between knowing 25% and 50% about triangle congruency?  I thought carefully about what is being measured and what was being communicated by those numbers.  I decided to jump to another arbitrary scale– the GPA scale– that corresponds better to the rubric messages I was sending.  (A single 1/4 no longer drags an entire average down like a single 25% does.)

3.  Skip comments. (* 2016-03-19 For additional context on this, and perhaps differing opinions / additional options, see Dylan Wiliam on Feedback)

If your problems are all on the same scale, and that scale has a versatile rubric… what comments do you need to write?  Here are typical comments I used to write:

“Good idea!  What if you apply that here?”
“I like this, but you can’t always do that step because …”

Comments vs. Revisions

Comments vs. Revision Expectation

Sure, ideally we could devote unlimited attention towards a single student and use various pedagogy to improve their work.  But we have 150 students.  Time you spend on one student is time you are taking from the others.  What did my comments achieve above?  Was it worth the time I spent on them?  Did the students internalize it?  I do think there is a benefit for personally coaching or cheerleading and encouraging students, but is it a good use of time to handwrite?

Here’s what I started doing instead:

  • I would score using the holistic 43210 rubric.  “How good is their solution?”  But that wouldn’t be the only marks on the page.  I might circle things to guide their attention, or put happy faces or stars as shorthand approvals/encouragements.
  • I would make notes of “interesting mistakes” ala My Favorite No, and use them as information to structure future lessons.  Because, if one kid has a misconception… how many others share it?
  • I carved out class time for students to work on revisions.  This could be structured individually, or peer-review, or office-hours-style, or whole-class error analysis… or some mixture of those styles.

A student who reads comments may gain a lot from them.  But what are they supposed to do?  Wait until the mythical “next time” to address the concerns you wrote? Comments written on a “dead” assignment are asking to be thrown away and forgotten.  But if you give students the expectation of revisions, then all you must do is indicate what must be revised.  The assignment lives on!

This cut my grading time down by at least half.  But also it served as a formative assessment of the class progress, allowing me to still make comments– but this time it was in person, to multiple students at once, and with the structured intent of them figuring out what was wrong.

Revision days sound like they will eat into your classtime, but instead they remove the need for “review/reteach days”.  Plus, the students get the extra practice with critiquing and analyzing work.  PLUS the grading is much less time consuming on the teacher side. PLUUUSSS it encourages culture in your class centered around improvement, growth mindset, and increases the value of every assignment you give.

4.  Ok what’s step 4?  Standards Based Grading.  This one is a doozy.  To switch completely towards assessing student’s understanding, rather than compliance, you can switch to SBG.  This is an entirely new way to grade, as it requires identifying what standards are being assessed when, and how you are going to decide what kind of scores mean what kind of mastery.  It also requires holding the line against some external pressure: the principal and the parents and the students themselves may resist the new style.  But with the previous steps 1,2,3 above, you can be halfway there and then feel out how to make the final leap.  There are various blogs about how to adjust, (I like Sam Shah) and various software to help support you (check out JupiterGrades and/or ActivGrade)

What you’ll find if you head down this road is that you begin by re-thinking what you actually want to assess… and you end by re-thinking how your assignments even work!  First you think, why even grade a drill worksheet of linear equations?  Then you think, what type of assignment will give the students opportunities to vary strategies and produce interesting responses to analyze in revision?

Let me know what you think… Let me know if you have similar or contributing ideas… And definitely let me know if you try it!

The effects of User Interface design on testing

Jason Dyer posted an excellent critique of some of the exam items and interface choices made by the American Institute for Research and their development of new Common Core exams.  The one he reviewed is called “SAGE”.

Designing an User Interface is difficult work.  Especially when your UI will serve thousands upon thousands of people.  But the most important part of the UI for education testing purposes is that all efforts should be made to minimize the effect of the UI on the measurement of the student’s test performance/score.

I believe the SAGE test has huge flaws that will affect the validity of the test results.  If students, teachers, schools, districts and even the Common Core standards themselves are to be judged on these results, I believe a lot more work needs to go into the UI Design.

Here is an example flaw, as described by Dyer:

The percents in the problem imply the answer will also be delivered as x%, but there is absolutely no way to type a percent symbol in the line (just typing % with the keyboard is unrecognized). So something like 51% would need to be typed as .51. Fractions are also unrecognized.

(Also the problem is not precisely worded, if I were nitpicky– and I am– then I would restate it to read, “If Ms. Jones chooses a student at random from her class, what is the probability…“)

We may intuit that the authors+designers of this question and its interface have either (a) not given thought to the difference between .51 and 51% or (b) did give though, but decided that the input box’s restrictions may be enough to guide towards the decimal response.  Note that in either case, the authors+designers do not consider the format change from the question to the answer to be significant.  What would Strunk and White say?

To a person with reasonable mathematical maturity, it is clear that .51 and 51% are interchangeable in this context, while not formally stylistically equivalent.  But these tests are supposed to measure a population whose mathematical maturity is in question.

The other more subtle element to this type of UI design is that the input box guides the user to do certain actions.  In a way, it is a part of the question.  A student may not type in 51/100.  A student attempting to type “%” is silently blocked from doing so.  These unspoken rules of communication and interaction should be paid attention to.  Do they affect student/user behavior?  Is the effect “regressive” in the sense that a low-performing student is more likely to have trouble deciphering the interface? (and therefore is more likely to not perform well on this test item)

The other example is rather indicative of the low level of attention the UI has recieved:


Enter each number on a separate line” is kind of the opposite of the issue from the percents problem above.  In this case, the authors+designers consider their interface to need direct instructions on how to respond.  On top of being incongruous in style, it is just plain wordy.

The designers of these tests seem eager to move away from the multiple choice style of test questioning. Multiple Choice has the big drawback in that the answer is given, hidden only by the distractors, which as a set may give clues as to which response is not like the others.  Its something that must be considered carefully when creating a MC test.  So, exploring alternative response systems enabled by the technology is reasonable.

Perhaps the authors did not want to label the input boxes? First Number _____  Second Number_____  I can certainly see the reason to avoid “first” and “second” along with “number 1” or “one number” and “another”.

Perhaps the authors did not want to use variables?  Two numbers, x and y, have a product of 323 and a difference of 2.  x=___ y=___  Ok, maybe variables would be beyond the scope of the test, or would be unfamiliar to the students at that stage.

But there are other options.  The answer input boxes could be embedded inline with a complete sentence.  The two numbers are  ___ and ___.

Finally, Dyer points out that the question implies one solution {17,19} but there is another {-17,-19}.  And it makes me wonder how the test is to be graded.  Wolfram Alpha has demonstrated the capability of software to interpret various mathematical inputs.  Can we grade these tests by computationally checking the answers rather than comparing to an answer key?  If a student inputs -17 and -19, why not compute the product and difference and see if it matches the stem?  Can a computer algebra system or dynamic geometry software check the results of student inputs by calculation?

I believe it is very difficult to design these items well, and I do think it is worthwhile to explore a variety of input methods, however, I believe that more effort needs to be taken to standardize input methods.  I believe that the best interface for these tests is one that the user is minimally aware of, i.e. the user should not have to figure out how to take the test in addition to taking the test.

What *are* quadratics?

Earlier today I was in a discussion with @mathhombre on Twitter about what is needed in an College Algebra course (roughly equivalent to Alg2+Precalc for high school).  I came to the (perhaps too radical) idea that lines are simulateously one of the most applicable concepts to a person’s “real life” but also one of the most useful tools for accessing higher math.  There are entire areas of study about linearization as a tool to simplify complicated cases not just in pure math, but economics, physics, engineering, etc.

Any that is just the prelude.  If we are going to talk about lines, what happens to the darling of any high school level algebra course?The quadratic function / The parabola.  parab product thumbConsider f(x) = x^2 – 2x – 15.  Factoring, we obtain f(x) = (x+3)(x-5).  A subtle idea that might be skipped over: f(x) is the product of two lines.  Literally lines y = x + 3 and y = x + 5.  Do our strudents face the idea that a linear factor and a line are the same?  Consider the product of the values of the lines — point by point.  Try it with Geogebra.  The f(3) = (line1 at 3)*(line2 at 3) = (6)(-2) = -12.

We also know the Fundamental Theorem of Algebra will guarantee n roots for a degree n polynomial.  But those n roots may have non-real parts, for example g(x)=x^2 + 4 does not factor over the reals  g(x) = (x+2i)(x-2i)

So can our “line*line” idea survive these new types of models?  And where can we see these complex lines?  The product relationship still holds.  g(3) = (3+2i)(3-2i) because the imaginary terms will cancel since complex roots always come in conjugate pairs.  g(3) = 3*3 + 3*2i + 3*-2i + – 2i*2i = 9 + 4 = 13.  But wait, lets slow down.  3 + 2i is a point.  A point on the line x+2i.  It is a line hidden to our view because we lack the dimensions on our plane to see it.  We have only the 1D real line as our inputs.

So lets consider the imaginary part of our domain.  Click the picture to see a larger view:

angled view 1That’s g(x) = x^2 + 4.  The red axis is the standard x-axis.  The green axis is the standard y-axis.  But the blue axis represents the imaginary part of our domain.  A normal classroom might be used to plotting 3+2i on a plane, but do we often make note that its a nominally different plane than the one we graph functions upon?  3+2i will be on the plane that passes through the red and blue axes.  I chose to view it this way to keep y outputs as close as possible to our usual view.

angle view 2 angle view 3Ok so lets see 3+2i and 3-2i and their output product 13.  I included two views here since it is difficult to get a grasp of the 3D situation.

These lines y = x+ 2i and y = x – 2i are kind of abuses of notation.  They should be specified that they are lines in space, namely y=x limited to the level planes Im = 2 and Im = -2.

There’s certainly more to do with exploring this idea, especially making the presentation more robust.

What really appeals to me is the symmetry of a quadratic’s complex conjugate roots is similar to the symmetry of a separate quadratic’s real factors around the axis of symmetry.  Even more, the idea of the imaginary number i as a 90 degree rotation fits puzzle pieces together.  The complex roots are 90 degree rotations around the axis of symmetry of a reflection of the parabola (reflect across a horizontal line passing through the vertex).  This is the part that holds some promise, but that I haven’t quite explained in my own head yet.

I invite you to play around with the Geogebra applet I used to explore this.  It is set up to start with x^2 – 8x +18.  Find the complex roots algebraically first, then see if it meshes with the visuals in the applet. Thoughts?angle view 4

The Lines are Not Always Parallel! A geogebra approach to Alternate Interior Angles

alt int angle image bigStudents are frequently confused by us harping on the importance of things that seem obvious: because we hardly ever show them the cases where the theorems are false.  One of the areas this comes up is Angles in Parallel Lines.  (The whole course of Geometry may feel like this, actually).  We teachers might feel like, “how do kids get confused here? its so easy and obvious!”  That’s right… so easy and obvious that we teachers have lost sight that we only show them these narrow cases.

We spend time proving that certain pairs of angles on parallel lines are congruent or supplementary.  Over and over and over… but always parallel lines!!  Maybe maybe we make an offhand comment about “if these lines weren’t parallel then the angles wouldn’t be congruent!”.  But those words hardly paint the picture for student.

But think of the infinite number of line that are not parallel!!

GeoGebra-logoSo, let us turn to Geogebra.  My philosophy in making this applet (and most of my applets) is to loosen some restrictions in our normal presentation so that more of the “sample space” can be explored.  Lets consider all lines cut by a transversal, not just parallel lines.  Then how many students will not only (1) appreciate parallel’s special nature and (2) make conjectures about congruent angles all by themselves?   This is much in the same vein as Michael Serra‘s Discovering Geometry book: set up a situation so that the students actions will lead them to make those conjectures.

The applet here lets students drag the line to all positions, and illustrates the red and blue angles, giving no measurements.  We want intuition here, not measurement.  Students might already have some idea “yeah they look close enough”.

The check box “Compare Angles” allows them to update their intuition when faced with a little more precision.  This kid who wasn’t able to articulate anything before might now realize in what realm we are trying to explore.

The check box “Compare Lines” allows them to make a connection to the properties of the pairs of lines.  Again, this is some non-verbal feedback and prodding to a student.  The student must assimilate this and then can provide the verbalization themselves.

Finally, I added in a little game at the end.  It will spit out a score based on how close to congruent the angles are.  (The formula is arbitrary, but spikes up very high when you’re close).  Let me know how this plays out with your students!  Do they get invested in beating each other’s high scores?  If so, notice that in trying to beat one-another, they must know that they want to make the lines “more parallel”.  Here we can embrace the difficulty of being precise when doing this with a trackpad or touchscreen.  Will your students say “hey if I could make them parallel, that should be an unbeatable perfect score!”  (I actually think Geogebra will spit out “infinity” score if it gets close enough– a happy consequence of the data structures they’re using)

Coin Problems — what are they structuring?

Dan Meyer posted a classic example of a “coin problem” the other day on Twitter.  The problem was in Pearson’s Common Core Algebra 2 text.  Lets assume positive intent from Pearson’s authors in their choice of inclusion here, since at first glance, it may not seem very “common corey”.  But actually, regardless of their intent, lets see where this kind of problem has (1) traditionally taken us and (2) what we can do with it to explore non-traditional approaches.

This post is adapted from my comments in Dan’s thread.

Mark has 42 coins consisting of dimes and quarters. The total value of his coins is $6. How many of each type of coin does he have? Show all your work and explain what method you used to solve the problem.

What kind of problem is this?  Usually this comes up during a systems of linear equations unit in an Algebra 1 class.  The text itself is an Algebra 2 book, so we’re probably safe to assume their intent is to use it as an example of a slightly dressed up system of lines exercise.

So my thoughts are to step back a little bit.  (1) its 2 equations and 2 unknowns — what is interesting and important about those?  What kind of mathematical structure is this?  (2) What does the context of coins do to our structure?  (3) Does the coin context add to our ability to uncover the underlying structure?

Intro

Consider its a little strange to know how many coins you have but not how many of each denomination.  An initial sign of contrived context that students pick up on.  Mostly by high school, students have formed some identities in the classroom that oblige them to cooperate with teacher instruction, so if they’re not initially interested, they may hang with you a little bit. But perhaps some loudmouth in your class will point out some of the strangeness of the contrived situation. #embracetheloudmouth

So perhaps at some point during the lesson series you then have the opportunity to say, “you’re totally right, Lou D’mouth, in what situation could we know the number of coins total and their value total, but not their partition?”

This is where you can set up the class to turn this coin problem on its head, as it were.  (rimshot!)

Letting the kids “get meta”

I like Denise Gaskins’s @letsplaymath idea:   Turn it into a 20-questions game: Stu reach into coin jar & grab handful, others ask Qs to find out what coins they have.?

This changes the requirements of the task: not only do we want to find a solution but we care ostensibly about how efficiently we can do it with respect to the number of questions asked.  Why does it take at least two questions?  Denise’s activity might not go on very long but that’s fine because why will the students stop doing it? They’ll figure out how easy it is!  They’ll wrap their heads around it.  Maybe the teacher can explicitly challenge groups to try to ask a single question to answer # of quarters and # of dimes.

(Presumably, we’re going to disallow “how many quarters?” although its still interesting that we still need two questions there…)

Furthering this section could be questions like:
Q.  If you ask “how many quarters?” and they respond “8” then why does that not let us know how many coins are in their hand?

Expand on the Structure

Now we can acknowledge the contrivance because its going to lead us to something special about this mathematical structure. We acknowledge and loosen our contrivance: parameterize the # of coins.  A number of people on twitter responding to Dan had this idea in addition to myself.

(Lets make the numbers smaller) Say we have $2.00 If we only use quarters and pennies… how many coins do we need? N=8 coins (8q0p) is one way… N=104 is another (ask how!).

1. spend some time finding Ns. mathematical practice standard: make use of structure! (How do we know when we’re done?)

2. To add up to $2.00 does every N (coin total) break down into only one quarter and penny partition? why?

3. Why do some Ns (105 e.g.) not have any solutions?

4. ***What is it about the quarters and pennies, Ns, and $ totals that forces us to have unique solutions or not?***

and 5. Can we contrive a coin-situation so that there are $s,Ns with multiple quarter-penny partitions? Is this possible?

Think back to when you were a student

I remember a lot of handwaving and “worship” in my own education towards the fact that 2 equations and 2 unknowns has a solution. (and 3 eq, 3 unknowns, etc…)

But statements like “ok so this is 2 equations and 2 unknowns so we know how to do it” are exactly what contribute to the magic spellbook idea of math. Kids feel that those who are good at math know the right spells to incant, and “2 equations 2 unknowns” must be a pretty good spell if it makes answers appear out of nowhere!

Don’t solve too quickly

I think this would be a rare case in which I would NOT go for a graph quickly. Yeah, we know about intersections of lines. Yeah we can show these coin relationships are linear.

But can we justify to ourselves that this idea of limited solutions based upon # of constraints is generalizable? We start with quarters pennies sure. In the middle maybe we prove something about # of solutions of systems and we talk about other ideas like mixtures and such. But by the end? We need students to grok (http://en.wikipedia.org/wiki/Grok) this idea of systems and solutions.

Descartes before dehorse

Maybe this is something that the teacher holds in his or her head.  But the deeper and richer the teacher is thinking about the mathematical structure, the more links and hooks and connections can be made between student ideas.  Here we might think about the genius of the Cartesian plane a little bit:

The graph informs us of:

– the infinite nature of the linear models
– the monotonic nature of the linear models
– the difference in ratios between coinA:coinB and valueA:valueB (thus different slopes)
– all of the ordered pairs that fit the conditions of the coin count
– all of the ordered pairs that fit the conditions of the value total

And combining our geometric knowledge about lines at different angles, mapping that onto the linear models, mapping THAT onto the coin situations… that’s how we are justifying our singular solution.

How this all might play out in a classroom would be just that extra 15 seconds of wait time, that extra question for group discussion, that incremental food for thought…

Not so much that we want a full answer, but that we want the students to take up the role of justification.

T, to S: “Why DO we know there is one solution here…?”

Let the students bring it out into the discussion

And if S reasons via graph, great!

But S might say something like: “well if we take off a quarter, and add a time, we keep the coin total at 42, but lose value…. we’ll always lose value at this way so there can be no solutions with more quarters!”

That’s (a) proof by contradiction and (b) using concepts that apply for theory of functions: decreasing, monotonic. (in this case its a sequence) But also the S has synthesized a hypothetical that generalizes to a larger case: take off a quarter, add a dime. Then they’ve upped their abstraction by arguing that any case like that will not provide a solution. (And similar arguments can work for adding a quarter, subtracing a dime)

Then T has the opportunity to engage the class in a discussion of bridging the graphical and the deductive reasonings.

It may very well end up becoming a discussion on why Cartesian graphs are so great, and all the better! Lots of students struggle with graphing because they are stuck on procedure without realizing what a graph represents specifically in an instance, or generally.

Bouncing off the Literature

In the beginning of this post I brought up the idea that a student will go along with some ridiculous contrived situations because they feel obligated to conform to a certain identity in a math class.  I’m considering this in the context of Dr. Paul Cobb’s 2009 article regarding how students create, maintain and alter their identities during their education.  This can be a bad thing, as in the case study course:

The frustration and disenchantment that all the students voiced indicated that they were not identifying with mathematical activity as it was realized in this classroom but were instead merely cooperating with the teacher. (Cobb, 2009)

P., Gresalfi, M., & Hodge, L. L. (2009). An interpretive scheme for analyzing the identities that students develop in mathematics classrooms.Journal for Research in Mathematics Education, 40-68.

When thinking about classroom discussions, I enjoyed Walshaw and Anthony’s 2008 paper on classroom discussions.  A favorite quote:

Unless teachers make good sense of the mathematical ideas they hear in class, they will not develop the flexibility they need for spotting the golden opportunities and wise points of entry that they can use for moving students toward more sophisticated and mathematically grounded understandings. Reflecting on the spot and dealing with contested mathematical thinking demand sound teacher knowledge. Importantly, the way in which teachers manage multiple viewpoints is very much dependent on what they know and believe about mathematics and on what they understand about the teaching and learning of mathematics.

Walshaw, M., & Anthony, G. (2008). The Teacher’s Role in Classroom Discourse: A Review of Recent Research Into Mathematics Classrooms. Review of Educational Research, 78(3), 516–551.

Geogebra Doodads

Geogebra is a great tool for communicating mathematics.  In recent versions, developers have added the ability to export to HTML5 (as opposed to Java) making it even easier to share a ggb file.  In addition, an animated .gif file can be created from any ggb file with a slider in it.

In the past, I have dumped my various student activities and teacher presentations in one large directory.    Now, I want to start putting out my work in a little more organized fashion, by introducing them on the blog and tagging and labeling.  For now, I’ve decided to call them “Doodads”.  Perhaps a better vocab word is out there to represent the interactive, mathematical, and curiosity sparking nature of these creations.

Here is the first one:

Time Angles (ggb doodad)

In the spirit of Dan Meyer’s WCYDWT, what is the first question that comes into your head?

The “answer” :

Copper Tiling… classic WCYDWT

Ran across this on reddit

The smile inducing “how much does it cost?” is a great place to start.

But how about “how much area is wasted?” to touch on the packing problem of circles. http://en.wikipedia.org/wiki/Circle_packing_in_a_square

And hey, might as well kick it up into 3D… http://www.youtube.com/watch?v=uDJ3sor2oQ0