Comments from other sites: Four animated gifs of the same awesome problem (dy/dan)

CFOS: Comments from other sites: I do a pretty good amount of writing online about math and math ed… just its not always here. In these posts I will link to the other site and copy over my comment with some context if needed. Mostly this is for me, so that I have a journal of what my thoughts were kept in one place.


Today’s CFOS is from Dan Meyer’s blog regarding the wonderful and somewhat famous task posed by Malcom Swan.  Dan writes,

Here is the original Malcolm Swan task, which I love:

Draw a shape on squared paper and plot a point to show its perimeter and area. Which points on the grid represent squares, rectangles, etc? Draw a shape that may be represented by the point (4, 12) or (12, 4). Find all the “impossible” points.

We could talk about adding a context here, but a change of that magnitude would prevent a precise conversation about pedagogy. It’d be like comparing tigers to penguins. We’d learn some high-level differences between quadripeds and bipeds, but comparing tigers to lions, jaguars, and cheetahs gets us down into the details. That’s where I’d like to be with this discussion.

So look at these four representations of the task. What features of the math do they reveal and conceal? What are their advantages and disadvantages?
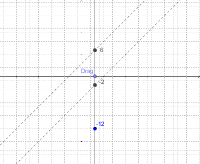
paper

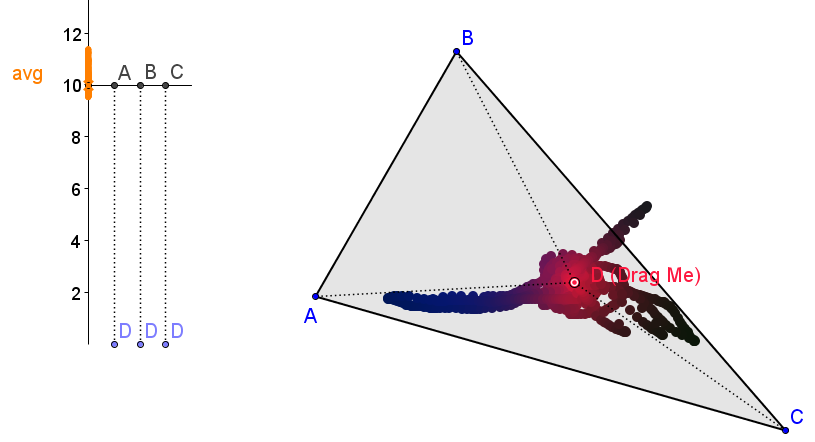
processing (code from Dan Anderson)


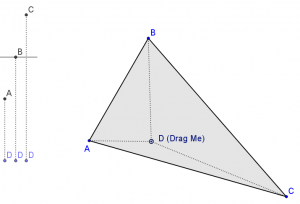
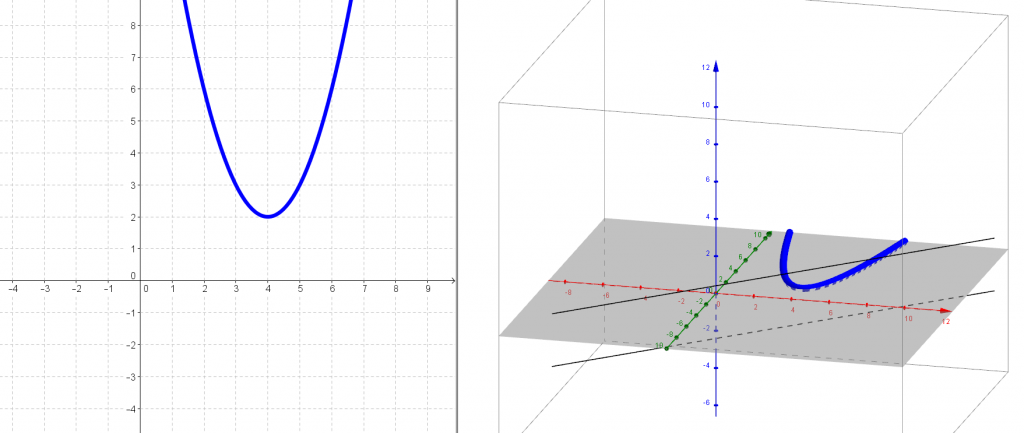
Geogebra by Scott Farrar

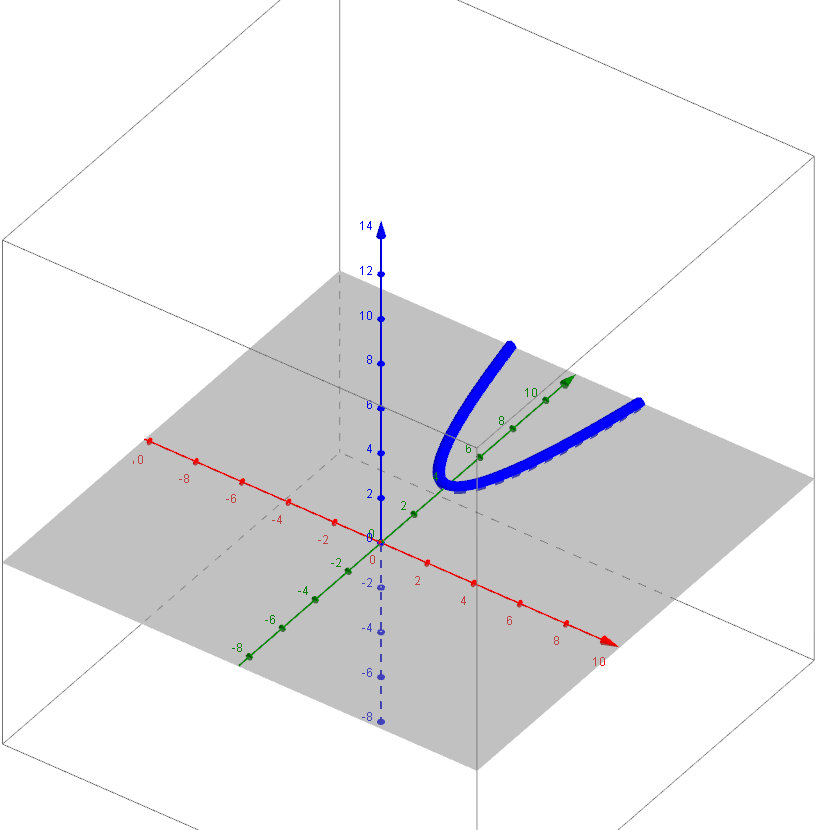
Desmos activity by Dan’s twitter followers


And my comments:

I’d love a combination of all of the above.

It appears that the Desmos activity had a drawback of no error checking. (Or, to call back your talk at CMC Asilomar, if this were a video game it would ask you to try again if your perim/area were impossible) In a customized Desmos applet, could you ask for width and height during the brainstorm rectangle phase, and then the second screen asks for perim and area? (couple more options here… you could still accept perim and area that do not match the given width, height: just flag them separately and then you can filter them out of the overlay or include them depending on where you want to take the lesson next)

It also appears that someone was investigating rectangles of a certain type, thus creating a rather straight line. Nice conversation starter there…

I think I am partial to the ability of my geogebra one to have the non-numerical entry point. On the other hand, they aren’t directly improving their skills in that arena either. A student is not hindered by calculation, but neither are they supported in it. But… I have liked giving a task to students where their interaction is manual and analog– meaning they are digging into the constraints and boundaries of a mathematical concept by physical motion and visual feedback. Does a student become immediately aware of and curious about this region that they cannot seem to get the dots into?

The processing one I like as a contrast to the hand-implemented geogebra. How would we systematically experiment around this idea? And when we devise a systematic approach, computers can be helpful in executing it. We can see the density of the dots is not uniform — what is the interaction between this perim v. area relationship and the way we have implemented our experiment? (I would guess the rectangle dimensions are chosen at random, thus creating a would-be-uniform display if not for the fundamental perimeter-area idea.)

The hand graph is limited in iteration, prone to calculation error, and slow. However, its requirements are all internal (save paper and pencil) rather than computer-based. Graphing by hand is perhaps the handle onto all of these other ideas. Is there research around how the concept of cartesian graphing changes if we grow up experiencing it in the computerized sense without the pencil and paper sense? I wonder!

For now I’d love to mix all of these in the classroom. When I spoke about this problem at Asilomar 2013, I used Malcom Swan’s initial prompts and provided grid paper for the attendees to grapple with the problem. Only afterwards did I move to the geogebra version (2013 version here, that has a slightly different scope)
And I would start the same way with students now. Here’s a rough timeline for a 1-2 day lesson:

1. paper rectangle in groups. Make a Perim v. Area graph on paper in your group that has your four rectangles. (this may correct some errors right away, like if kids put width and height instead of perim/area, their group may correct them)
2. Groups share on Desmos, add more rectangles. They are released from having to graph them on paper now. We are letting that go because Desmos will pick it up. Thus allowing students to step up their conceptual / abstracted approach.
3. class discussion, noticings, wonderings, address errors… blank region may become clearly curious here. Ok, now we’ve used the Desmos tool, but if we want to dig in with more rectangles, lets switch tools.
4. Geogebra sketch and/or programmed iteration. Groups come up with things to try and experiment with on the geogebra sketch, or devise a script that would generate perims and areas and plot them like Dan Anderson’s.
5. Return of the single case. Which points are on the edge? Can investigate with Geogebra sketch by hand. Or: can hand the class a mission on Desmos: “come up with rectangles that you think are on the edge”.
6. depending on the level of the class you can lead this towards some kind of proof or justification, entice students to make reasoned conjectures about what is going on.

Now we’ve taken the stepping stones from drawing a single rectangle to an aggregate set of many rectangles and their (p,a), to a set larger than what we could human-ly create. When we’re on step 4 there, we’re getting a handle on the abstraction of perimeters and areas of rectangles, thus allowing us to experiment with the abstraction just as easily as we worked with a single rectangle on paper at the beginning of class. But then we can go back and use each tool for what it helps with.

That, I believe, is the power of education technology: giving concrete handholds to abstract concepts. But tech is at its most powerful when working in concert with non-tech methods. And the possibilities of tech are so wide that no single tool was the magic bullet that enables this lesson– each one exposed a new vector to take.

Finally, remember Swan’s prompts (that did not aim to use technology) originally got at the existence of this concept by suggesting an impossible point and then suggesting that there are many others to find. His prompt defines these two regions (that we might call white and red for our purposes) with two examples: one red and one white. I wonder what the difference is about investigating the existence of white and red by imagining and reasoning on paper vs. bouncing up against their boundary on the geogebra applet.


Student Inquiry into the Neighborhood of the Special Case

Lets look at Triangle Centers: a fun unit for many Geometry classes.  Its a topic with some good “real-world” applications, certainly, but we need not always justify our lessons with application.  And it may hold us back from important mathematical practices.  Pure math is underrated!  Lets compare some traditional textbook style application problems with an interactive style problem.  First, Holt Geometry:

angle bisector from holtangle bisector 2 from holt
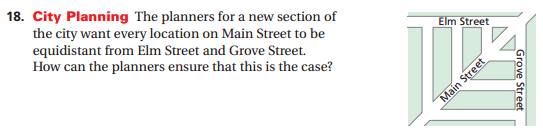
Those two problems are somewhat typical of some application motivators.  But consider a correct response from a student:

18.  Main street should be the angle bisector of the angle between Elm Street and Grove Street.
37.  Bisect the angle between the streets.  Draw the perpendicular bisector between the museum and the library.  The visitors center should be where those two lines cross.

How does this capture the imagination of a student?  If they know what an angle bisector is, they can supply an answer.  But if they do not know it (or haven’t made the connection about equidistance from sides) what kind of feedback can you give them that guides them to the answer without providing the answer?

But the book already provided the direct answer, earlier in this section: Theorem: a point is on the bisector of an angle if and only if it is equidistant from the sides.  #18 is almost explicitly asking for this theorem.  #37 asks a little more: it wants this theorem combined with the perpendicular bisector theorem, which led off this section– no prelude.  These questions are merely dressed up versions of those on Level 1 and Level 2 of Bloom’s Taxonomy.


With GeoGebra, we can provide loads and loads of information that (1) helps guide the student around the topic we want and (2) does not provide progress towards “the answer” in discrete unassailable steps.  We can be more helpful while being #lesshelpful.

dist vertex 01Here is a picture of an applet I created to give some real-time information to students about point D and triangle ABC.  And here is the interactive applet itself, try it!

In this first static picture, what information is given to students?  Most students will be keen enough to see the comparison of the distances DA, DB, DC.  And all students will catch on after they start dragging point D.

What do we need to ask here to get students to think about perpendicular bisectors?  I say: “not much!”  My introduction to the applet is “Drag point D.  Find special locations.”  That’s not to say I’m not communicating with the students.  I’m communicating a great deal more!  I’m communicating through the boundaries and feedback programmed into the Geogebra manipulative.  Manipulatives are powerful in any setting, but computerized manipulatives enable modes of lessons not possible before.

I love doing triangle center lessons via oragami (or patty) paper.  I love doing triangle center lessons via compass and straightedge.  But the boundaries of those manipulatives do not guide the students.  If you make an incorrect fold or line, the paper doesn’t tell you so.  If you want to test distances with your compass or ruler, you must do them one at a time.  If you want to pursue a question other than equidistance (e.g.) then there may be other complicated procedures to follow.

Consider with GeoGebra:  by restricting the interaction to only dragging D, the students may no longer make unproductive moves.  Every move they make produces feedback via the distance “bar graph” and the color shading of D itself.  That feedback isn’t telling the student “incorrect”.  It is telling the student “here are the distances your input asked for.”  The student is then left to parse that information, and respond with more input.  This type of interaction between student and computer occurs within a fraction of a second.  And this type of interaction is repeated tens, hundreds, or thousands of times.  The student can then use the information to start digging into the prompt: what are the special locations for D?  What makes a location special anyway?  These are questions that can be asked and answered by students without teacher interruption.

dist vertex 02But wait, there’s more!  Lets say a student has decided upon finding the place where DA=DB=DC.  Computerized Manipulatives now allow a task between this decision and the answer.  They must spend time actually getting point D to the correct spot.  In this Geogebra applet, they have the feedback from color and the bar graph to help them, but here is where the teacher can wait for a student to ask, “is there a better way?”  Boom!  We have arrived at the motivation for the circumcenter construction.  This motivation was driven by “pure” math ideas like equidistance… only we didn’t have to say it.  Proof in geometry should be introduced as a way to perfect our conjectures and hypotheses.  If the students haven’t made a conjecture, how are they going to care about its truth?

In this applet I decided to include an extension: another triangle center.  But this is not the usual 2nd center introduced.  Your students will find the blue point and notice what is special. Try it yourself!  Think about what is also done with this wordless separation of the two points in contrast to a lecture-based introduction: the students will have their own vocabulary to parse the difference that they have played with already, instead of the students having to parse vocabulary that describes a difference that they may not have been aware of.

In this applet I included two “answer” checkboxes.  Depending on where you want to take your class next, it they may steal some thunder from the lesson, but I figured I’d include them to help illustrate the point… and points. (hah)

GeoGebra and other computerized manipulatives enable us to think about Geometry and math in a way unfamiliar from static text or lecture.  Similar to The Lines Are Not Always Parallel, I’ve created a way for students to observe the neighborhood around the special case, and constructed silent helpful barriers and footholds that students can grab onto as they discover what is special for themselves.

Let me know what you think.


What *are* quadratics?

Earlier today I was in a discussion with @mathhombre on Twitter about what is needed in an College Algebra course (roughly equivalent to Alg2+Precalc for high school).  I came to the (perhaps too radical) idea that lines are simulateously one of the most applicable concepts to a person’s “real life” but also one of the most useful tools for accessing higher math.  There are entire areas of study about linearization as a tool to simplify complicated cases not just in pure math, but economics, physics, engineering, etc.

Any that is just the prelude.  If we are going to talk about lines, what happens to the darling of any high school level algebra course?The quadratic function / The parabola.  parab product thumbConsider f(x) = x^2 – 2x – 15.  Factoring, we obtain f(x) = (x+3)(x-5).  A subtle idea that might be skipped over: f(x) is the product of two lines.  Literally lines y = x + 3 and y = x + 5.  Do our strudents face the idea that a linear factor and a line are the same?  Consider the product of the values of the lines — point by point.  Try it with Geogebra.  The f(3) = (line1 at 3)*(line2 at 3) = (6)(-2) = -12.

We also know the Fundamental Theorem of Algebra will guarantee n roots for a degree n polynomial.  But those n roots may have non-real parts, for example g(x)=x^2 + 4 does not factor over the reals  g(x) = (x+2i)(x-2i)

So can our “line*line” idea survive these new types of models?  And where can we see these complex lines?  The product relationship still holds.  g(3) = (3+2i)(3-2i) because the imaginary terms will cancel since complex roots always come in conjugate pairs.  g(3) = 3*3 + 3*2i + 3*-2i + – 2i*2i = 9 + 4 = 13.  But wait, lets slow down.  3 + 2i is a point.  A point on the line x+2i.  It is a line hidden to our view because we lack the dimensions on our plane to see it.  We have only the 1D real line as our inputs.

So lets consider the imaginary part of our domain.  Click the picture to see a larger view:

angled view 1That’s g(x) = x^2 + 4.  The red axis is the standard x-axis.  The green axis is the standard y-axis.  But the blue axis represents the imaginary part of our domain.  A normal classroom might be used to plotting 3+2i on a plane, but do we often make note that its a nominally different plane than the one we graph functions upon?  3+2i will be on the plane that passes through the red and blue axes.  I chose to view it this way to keep y outputs as close as possible to our usual view.

angle view 2 angle view 3Ok so lets see 3+2i and 3-2i and their output product 13.  I included two views here since it is difficult to get a grasp of the 3D situation.

These lines y = x+ 2i and y = x – 2i are kind of abuses of notation.  They should be specified that they are lines in space, namely y=x limited to the level planes Im = 2 and Im = -2.

There’s certainly more to do with exploring this idea, especially making the presentation more robust.

What really appeals to me is the symmetry of a quadratic’s complex conjugate roots is similar to the symmetry of a separate quadratic’s real factors around the axis of symmetry.  Even more, the idea of the imaginary number i as a 90 degree rotation fits puzzle pieces together.  The complex roots are 90 degree rotations around the axis of symmetry of a reflection of the parabola (reflect across a horizontal line passing through the vertex).  This is the part that holds some promise, but that I haven’t quite explained in my own head yet.

I invite you to play around with the Geogebra applet I used to explore this.  It is set up to start with x^2 – 8x +18.  Find the complex roots algebraically first, then see if it meshes with the visuals in the applet. Thoughts?angle view 4

The Lines are Not Always Parallel! A geogebra approach to Alternate Interior Angles

alt int angle image bigStudents are frequently confused by us harping on the importance of things that seem obvious: because we hardly ever show them the cases where the theorems are false.  One of the areas this comes up is Angles in Parallel Lines.  (The whole course of Geometry may feel like this, actually).  We teachers might feel like, “how do kids get confused here? its so easy and obvious!”  That’s right… so easy and obvious that we teachers have lost sight that we only show them these narrow cases.

We spend time proving that certain pairs of angles on parallel lines are congruent or supplementary.  Over and over and over… but always parallel lines!!  Maybe maybe we make an offhand comment about “if these lines weren’t parallel then the angles wouldn’t be congruent!”.  But those words hardly paint the picture for student.

But think of the infinite number of line that are not parallel!!

GeoGebra-logoSo, let us turn to Geogebra.  My philosophy in making this applet (and most of my applets) is to loosen some restrictions in our normal presentation so that more of the “sample space” can be explored.  Lets consider all lines cut by a transversal, not just parallel lines.  Then how many students will not only (1) appreciate parallel’s special nature and (2) make conjectures about congruent angles all by themselves?   This is much in the same vein as Michael Serra‘s Discovering Geometry book: set up a situation so that the students actions will lead them to make those conjectures.

The applet here lets students drag the line to all positions, and illustrates the red and blue angles, giving no measurements.  We want intuition here, not measurement.  Students might already have some idea “yeah they look close enough”.

The check box “Compare Angles” allows them to update their intuition when faced with a little more precision.  This kid who wasn’t able to articulate anything before might now realize in what realm we are trying to explore.

The check box “Compare Lines” allows them to make a connection to the properties of the pairs of lines.  Again, this is some non-verbal feedback and prodding to a student.  The student must assimilate this and then can provide the verbalization themselves.

Finally, I added in a little game at the end.  It will spit out a score based on how close to congruent the angles are.  (The formula is arbitrary, but spikes up very high when you’re close).  Let me know how this plays out with your students!  Do they get invested in beating each other’s high scores?  If so, notice that in trying to beat one-another, they must know that they want to make the lines “more parallel”.  Here we can embrace the difficulty of being precise when doing this with a trackpad or touchscreen.  Will your students say “hey if I could make them parallel, that should be an unbeatable perfect score!”  (I actually think Geogebra will spit out “infinity” score if it gets close enough– a happy consequence of the data structures they’re using)

Geogebra Doodads

Geogebra is a great tool for communicating mathematics.  In recent versions, developers have added the ability to export to HTML5 (as opposed to Java) making it even easier to share a ggb file.  In addition, an animated .gif file can be created from any ggb file with a slider in it.

In the past, I have dumped my various student activities and teacher presentations in one large directory.    Now, I want to start putting out my work in a little more organized fashion, by introducing them on the blog and tagging and labeling.  For now, I’ve decided to call them “Doodads”.  Perhaps a better vocab word is out there to represent the interactive, mathematical, and curiosity sparking nature of these creations.

Here is the first one:

Time Angles (ggb doodad)

In the spirit of Dan Meyer’s WCYDWT, what is the first question that comes into your head?

The “answer” :

Triangles by side

I just used a mathlet I found online: “Triangles By Side” (source: Math Hombre) in a lesson for geometry. (uploaded here: http://scottfarrar.googlepages.com/geom2009 The worksheet http://scottfarrar.googlepages.com/TriangleCategories.pdf ) It worked very well.

A few notes:
0. This was our second day on triangles so I had not used the vocab for each category. I purposely left it to the end of class then we all labeled each category as a class. Students worked in pairs, 1 computer per pair.
1. Students were a little confused about starting with the scalene. There’s not much to “observe” there. I think the best one to start with is the isosceles.
2. Its kind of a shame that the 3,4,5 and 6,8,10 are the only right triangles possible. Next time I would bump the sliders up to 13 so that students could make a 5,12,13. (obviously we haven’t covered pythagorean, but students were able to find the triangles easily enough)
3. I actually didn’t have the 2nd mathlet up there when my students did it. They used the first one for both activities.
Pros: integer lengths for c are easy to list. Students had no trouble figuring out what to do.
Cons: students don’t automatically consider fractional side lengths for side c.
This can be a pro, however!! A kid says if a=4 and b=6, c can be 3, 4, 5, 6, 7, 8, 9. Then they are ripe for me to ask “can c be 2 and a half?” They can flip back and forth from c=2 and c=3 to guess at what c=2.5 looks like. Then I ask “can c=2.1? 2.01? 2.001?” It was great to have students interrupt me half-annoyed and say “As long as its more than 2, its ok

The one I just made (the 2nd one for 10-30) might be “too helpful” for day 2 of triangles. This is probably better as a review or lecture demonstration. http://scottfarrar.googlepages.com/triangleineq.html

So I think I might change my worksheet back to using the first mathlet, or a modifed version of the first. I’d limit the way they interact with side c first. Then I can give them more freedom to explore rational side lengths.

I welcome feedback and suggestions!

Circumcenters and Epicenters

http://scottfarrar.googlepages.com/circumcenter_lomaprieta.html

So I put together this mathlet in anticipation of doing Triangle Centers. I love it, and I hate it. On one side, I’m very satisfied with how it turned out implementation-wise. On the other side, I’m not satisfied with what the lesson is. This is not a 50 minute activity. So they find Loma Prieta. Big whoop! There’s not really a *problem* to solve.

Could I muddy up the data? Could I muddy the data? Or should I go and try to get actual USGS data in terms of when the first shockwaves were felt and where. With all the differing topography in the Bay Area, I’m sure the shockwaves were not perfectly circular. And yet, if we took a lot of data we could probably do the calculations/constructions needed in order to find a good estimate for Loma Prieta.

Whats frustrating is that this lesson is not ready, and I’m not sure if I’ll have time to get it all the way there by the time this comes up in the year.

Introductory Geogebra Lesson


I did this with my students about a week ago: http://scottfarrar.googlepages.com/geom2009

Previous Knowledge: students have copied and bisected angles and segments before “IRL” using compasses and straightedges.

It went very well for a “first time” on computers this year. The versions of the files I initially used did not limit their tools, but I have now changed the mathlets: you are limited to Euclidean constructions via compass, straightedge and points/intersections.

The fourth mathlet is too hard. The first three took most of my students about 20-40 minutes to get through. So I definitely need a fourth problem that is relatively simple, yet exposes them to something new in Geogebra.

“Free exploration time” works for some students, but if they are that interested, they can do it at home on their own computers. I’d rather have an engaging mathlet.