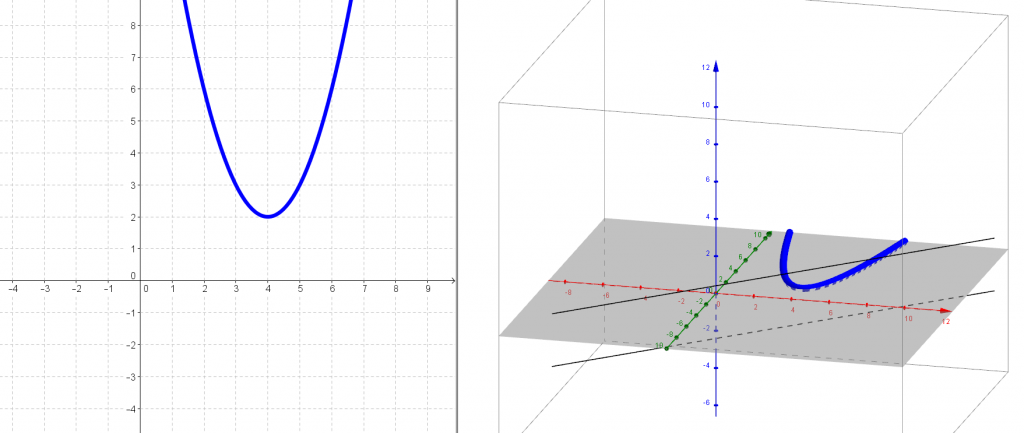
What *are* quadratics?
Earlier today I was in a discussion with @mathhombre on Twitter about what is needed in an College Algebra course (roughly equivalent to Alg2+Precalc for high school). I came to the (perhaps too radical) idea that lines are simulateously one of the most applicable concepts to a person’s “real life” but also one of the most useful tools for accessing higher math. There are entire areas of study about linearization as a tool to simplify complicated cases not just in pure math, but economics, physics, engineering, etc.
Any that is just the prelude. If we are going to talk about lines, what happens to the darling of any high school level algebra course?The quadratic function / The parabola. 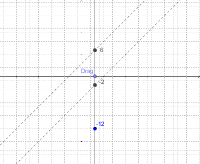 Consider f(x) = x^2 – 2x – 15. Factoring, we obtain f(x) = (x+3)(x-5). A subtle idea that might be skipped over: f(x) is the product of two lines. Literally lines y = x + 3 and y = x + 5. Do our strudents face the idea that a linear factor and a line are the same? Consider the product of the values of the lines — point by point. Try it with Geogebra. The f(3) = (line1 at 3)*(line2 at 3) = (6)(-2) = -12.
We also know the Fundamental Theorem of Algebra will guarantee n roots for a degree n polynomial. But those n roots may have non-real parts, for example g(x)=x^2 + 4 does not factor over the reals g(x) = (x+2i)(x-2i)
So can our “line*line” idea survive these new types of models? And where can we see these complex lines? The product relationship still holds. g(3) = (3+2i)(3-2i) because the imaginary terms will cancel since complex roots always come in conjugate pairs. g(3) = 3*3 + 3*2i + 3*-2i + – 2i*2i = 9 + 4 = 13. But wait, lets slow down. 3 + 2i is a point. A point on the line x+2i. It is a line hidden to our view because we lack the dimensions on our plane to see it. We have only the 1D real line as our inputs.
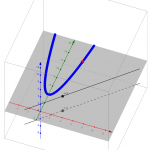
So lets consider the imaginary part of our domain. Click the picture to see a larger view:
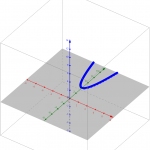 That’s g(x) = x^2 + 4. The red axis is the standard x-axis. The green axis is the standard y-axis. But the blue axis represents the imaginary part of our domain. A normal classroom might be used to plotting 3+2i on a plane, but do we often make note that its a nominally different plane than the one we graph functions upon? 3+2i will be on the plane that passes through the red and blue axes. I chose to view it this way to keep y outputs as close as possible to our usual view.
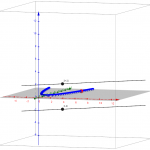
 Ok so lets see 3+2i and 3-2i and their output product 13. I included two views here since it is difficult to get a grasp of the 3D situation.
These lines y = x+ 2i and y = x – 2i are kind of abuses of notation. They should be specified that they are lines in space, namely y=x limited to the level planes Im = 2 and Im = -2.
There’s certainly more to do with exploring this idea, especially making the presentation more robust.
What really appeals to me is the symmetry of a quadratic’s complex conjugate roots is similar to the symmetry of a separate quadratic’s real factors around the axis of symmetry. Even more, the idea of the imaginary number i as a 90 degree rotation fits puzzle pieces together. The complex roots are 90 degree rotations around the axis of symmetry of a reflection of the parabola (reflect across a horizontal line passing through the vertex). This is the part that holds some promise, but that I haven’t quite explained in my own head yet.
I invite you to play around with the Geogebra applet I used to explore this. It is set up to start with x^2 – 8x +18. Find the complex roots algebraically first, then see if it meshes with the visuals in the applet. Thoughts?